> ## Documentation Index
> Fetch the complete documentation index at: https://docs.topsort.com/llms.txt
> Use this file to discover all available pages before exploring further.
# Vendor Analytics: Preview
> New analytics tab provides transparent campaign performance insights for vendors with comprehensive reporting capabilities
export const ChangelogActions = () => {
return <>
;
};
October 2, 2025
Ad Platform
New Feature
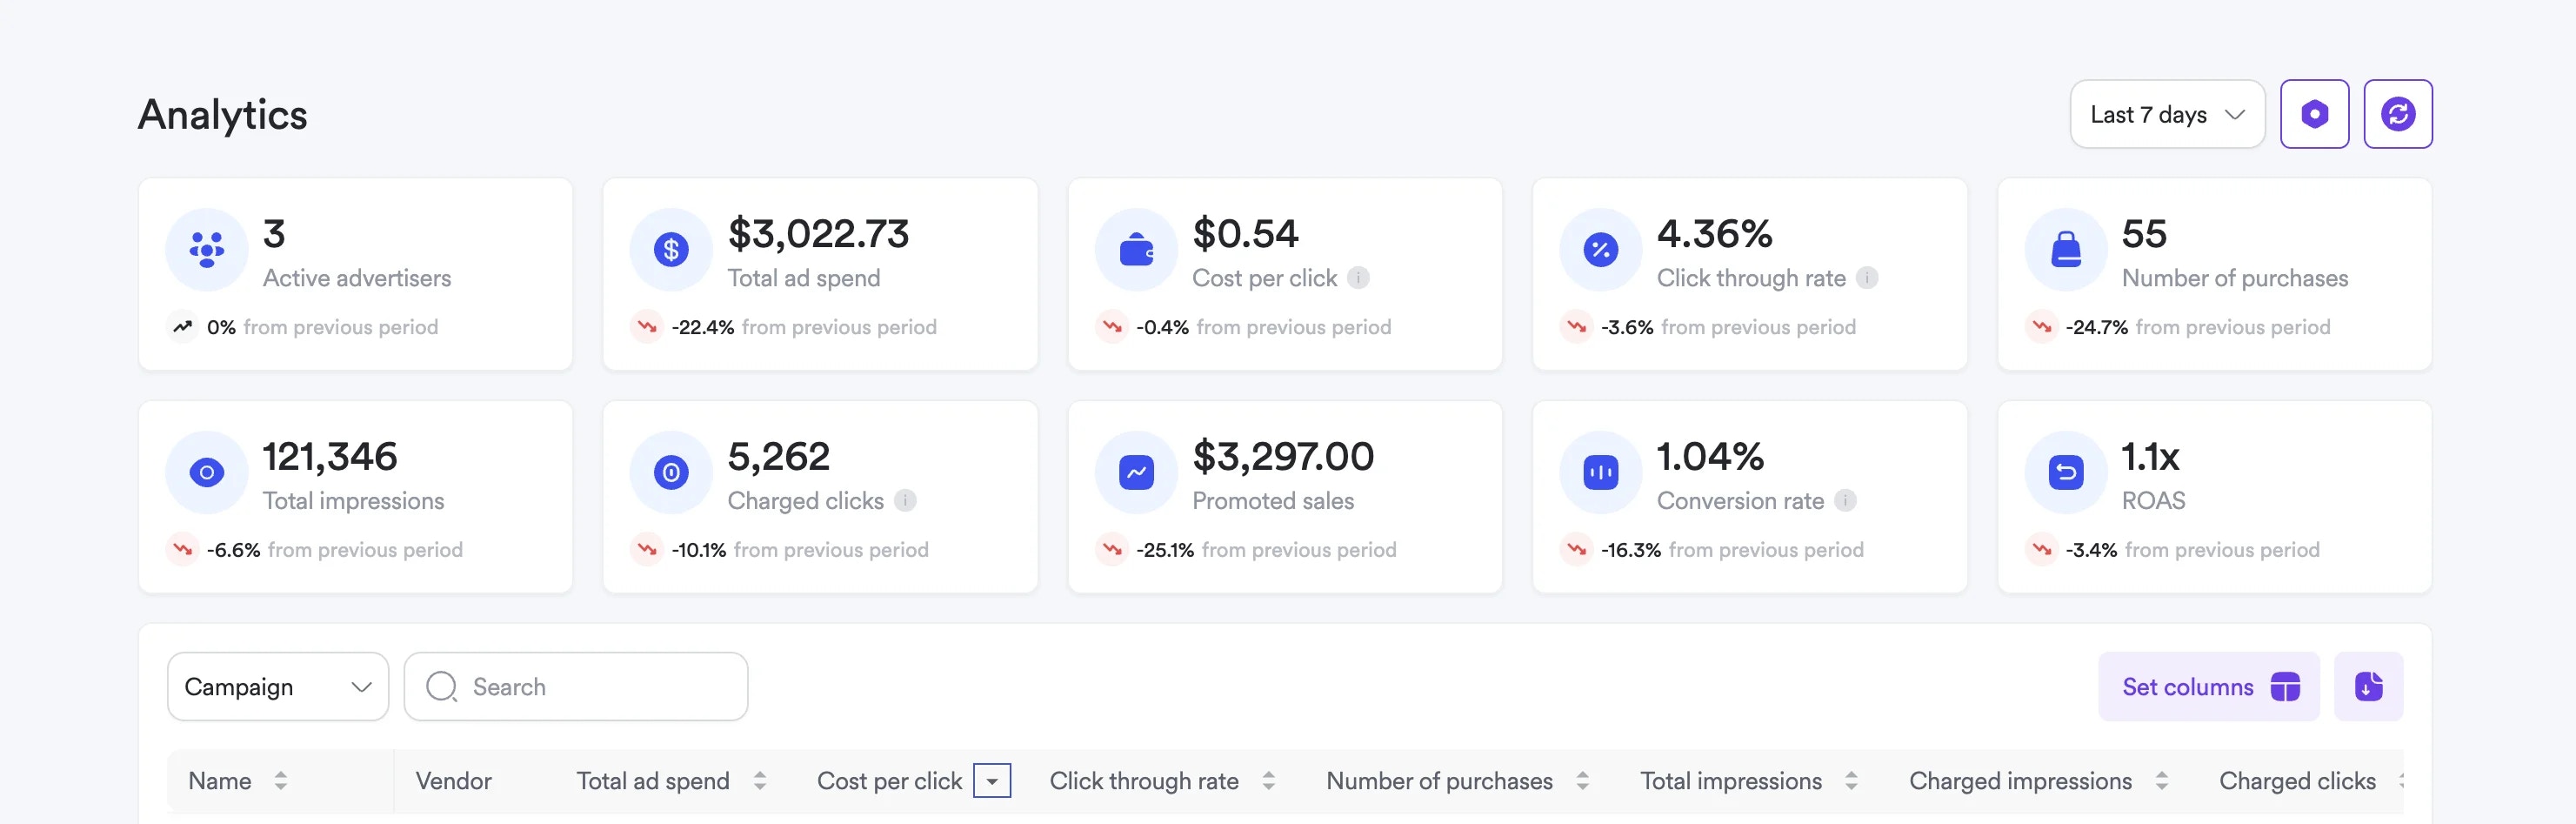
We've introduced a dedicated **Analytics tab** in Self-Service, providing vendors with transparent, actionable campaign performance data. This enhancement gives advertisers the visibility they need to optimize campaigns, allocate budgets effectively, and build trust in the platform.
## Key Benefits
**Transparent Reporting**:
Access comprehensive campaign metrics without dependency on support or
manual reports
**Campaign Optimization**:
Identify what's working and adjust strategies based on real performance data
**Budget Confidence**:
See exactly how advertising spend translates to results and ROI
**Agency Engagement**:
Strengthen vendor relationships with transparent, self-service analytics
**Actionable Insights**:
Make data-driven decisions with detailed performance breakdowns
## Analytics Features
### Performance Overview
* **Aggregated Metrics Tiles** - Key performance indicators at a glance
* **Campaign-Level Breakdown** - Individual campaign performance analysis
* **Timeframe Filtering** - Custom date ranges for targeted analysis
* **Export Capabilities** - Download performance data for external analysis
### Advanced Functionality
* **Search by Campaign Name** - Quickly find specific campaign data
* **Sortable Metrics** - Order campaigns by performance indicators
* **Customizable Columns** - Configure which metrics to display
* **Data Export** - Download comprehensive performance reports
## Using the Analytics Tab
1. **Access Analytics** - Navigate to the new "Analytics" tab in the Self-Service Dashboard sidebar
2. **Review Performance Overview** - View aggregated metrics across all campaigns
3. **Filter by Timeframe** - Select specific date ranges for analysis
4. **Analyze Individual Campaigns** - Drill down into specific campaign performance
5. **Export Data** - Download detailed reports for further analysis
### Analytics Interface
The Analytics tab provides:
* **Performance Tiles** - Quick overview of key metrics
* **Campaign Table** - Detailed performance breakdown by campaign
* **Search and Filter** - Easy navigation through large campaign lists
* **Empty State Handling** - Clear messaging when no data is available
***
The Analytics tab is will be available in the Self-Service Dashboard this week. This feature provides the transparency and insights needed to maximize campaign performance and make informed advertising decisions across your retail media campaigns.
 ## Key Benefits
**Transparent Reporting**:
Access comprehensive campaign metrics without dependency on support or
manual reports
**Campaign Optimization**:
Identify what's working and adjust strategies based on real performance data
**Budget Confidence**:
See exactly how advertising spend translates to results and ROI
**Agency Engagement**:
Strengthen vendor relationships with transparent, self-service analytics
**Actionable Insights**:
Make data-driven decisions with detailed performance breakdowns
## Analytics Features
### Performance Overview
* **Aggregated Metrics Tiles** - Key performance indicators at a glance
* **Campaign-Level Breakdown** - Individual campaign performance analysis
* **Timeframe Filtering** - Custom date ranges for targeted analysis
* **Export Capabilities** - Download performance data for external analysis
### Advanced Functionality
* **Search by Campaign Name** - Quickly find specific campaign data
* **Sortable Metrics** - Order campaigns by performance indicators
* **Customizable Columns** - Configure which metrics to display
* **Data Export** - Download comprehensive performance reports
## Using the Analytics Tab
1. **Access Analytics** - Navigate to the new "Analytics" tab in the Self-Service Dashboard sidebar
2. **Review Performance Overview** - View aggregated metrics across all campaigns
3. **Filter by Timeframe** - Select specific date ranges for analysis
4. **Analyze Individual Campaigns** - Drill down into specific campaign performance
5. **Export Data** - Download detailed reports for further analysis
### Analytics Interface
The Analytics tab provides:
* **Performance Tiles** - Quick overview of key metrics
* **Campaign Table** - Detailed performance breakdown by campaign
* **Search and Filter** - Easy navigation through large campaign lists
* **Empty State Handling** - Clear messaging when no data is available
***
The Analytics tab is will be available in the Self-Service Dashboard this week. This feature provides the transparency and insights needed to maximize campaign performance and make informed advertising decisions across your retail media campaigns.
## Key Benefits
**Transparent Reporting**:
Access comprehensive campaign metrics without dependency on support or
manual reports
**Campaign Optimization**:
Identify what's working and adjust strategies based on real performance data
**Budget Confidence**:
See exactly how advertising spend translates to results and ROI
**Agency Engagement**:
Strengthen vendor relationships with transparent, self-service analytics
**Actionable Insights**:
Make data-driven decisions with detailed performance breakdowns
## Analytics Features
### Performance Overview
* **Aggregated Metrics Tiles** - Key performance indicators at a glance
* **Campaign-Level Breakdown** - Individual campaign performance analysis
* **Timeframe Filtering** - Custom date ranges for targeted analysis
* **Export Capabilities** - Download performance data for external analysis
### Advanced Functionality
* **Search by Campaign Name** - Quickly find specific campaign data
* **Sortable Metrics** - Order campaigns by performance indicators
* **Customizable Columns** - Configure which metrics to display
* **Data Export** - Download comprehensive performance reports
## Using the Analytics Tab
1. **Access Analytics** - Navigate to the new "Analytics" tab in the Self-Service Dashboard sidebar
2. **Review Performance Overview** - View aggregated metrics across all campaigns
3. **Filter by Timeframe** - Select specific date ranges for analysis
4. **Analyze Individual Campaigns** - Drill down into specific campaign performance
5. **Export Data** - Download detailed reports for further analysis
### Analytics Interface
The Analytics tab provides:
* **Performance Tiles** - Quick overview of key metrics
* **Campaign Table** - Detailed performance breakdown by campaign
* **Search and Filter** - Easy navigation through large campaign lists
* **Empty State Handling** - Clear messaging when no data is available
***
The Analytics tab is will be available in the Self-Service Dashboard this week. This feature provides the transparency and insights needed to maximize campaign performance and make informed advertising decisions across your retail media campaigns.