> ## Documentation Index
> Fetch the complete documentation index at: https://docs.topsort.com/llms.txt
> Use this file to discover all available pages before exploring further.

# Quick reporting UI enhancements

> The Topsort Dashboard centralizes essential data in real-time, giving you everything you need in one place. We’re constantly innovating to present information more effectively, helping you make better decisions and adding value.

export const ChangelogActions = () => {
  return <>
      <style>{`
        .changelog-actions {
          display: flex;
          justify-content: center;
          gap: 12px;
          margin-top: 2rem;
          padding-top: 1.5rem;
          border-top: 1px solid #e5e7eb;
        }
        
        [data-theme="dark"] .changelog-actions {
          border-top-color: #374151;
        }
        
        .changelog-btn {
          display: inline-flex;
          align-items: center;
          gap: 6px;
          padding: 8px 16px;
          border-radius: 9999px;
          border: 1px solid #d1d5db;
          background: transparent;
          color: #6b7280;
          font-size: 14px;
          cursor: pointer;
          transition: all 0.2s ease;
        }
        
        .changelog-btn:hover {
          border-color: #9ca3af;
          background: #f9fafb;
        }
        
        [data-theme="dark"] .changelog-btn {
          border-color: #4b5563;
          color: #9ca3af;
        }
        
        [data-theme="dark"] .changelog-btn:hover {
          border-color: #6b7280;
          background: #1f2937;
        }
      `}</style>
      <div className="changelog-actions">
        <button className="changelog-btn" onClick={() => {
    const btn = event.target.closest("button");
    btn.innerHTML = "❤️ Like";
    btn.style.borderColor = "#ec4899";
  }}>
          🤍 Like
        </button>
        <button className="changelog-btn" onClick={() => {
    const btn = event.target.closest("button");
    navigator.clipboard.writeText(window.location.href);
    const originalContent = btn.innerHTML;
    btn.innerHTML = "✓ Copied";
    btn.style.borderColor = "#22c55e";
    btn.style.color = "#22c55e";
    setTimeout(() => {
      btn.innerHTML = originalContent;
      btn.style.borderColor = "";
      btn.style.color = "";
    }, 2000);
  }}>
          ↗ Share
        </button>
      </div>
    </>;
};

<div style={{ display: "flex", gap: "8px", flexWrap: "wrap", marginBottom: "16px" }}>
  <Badge color="gray" size="sm" icon="calendar">June 25, 2024</Badge>
  <Badge color="blue" size="sm" icon="rectangle-ad">Ad Platform</Badge>
  <Badge color="orange" size="sm" icon="arrow-up">Improvement</Badge>
</div>

The Topsort Dashboard centralizes essential data in real-time, giving you everything you need in one place.  We're constantly innovating to present information more effectively, helping you make better decisions and adding value. With this new update:

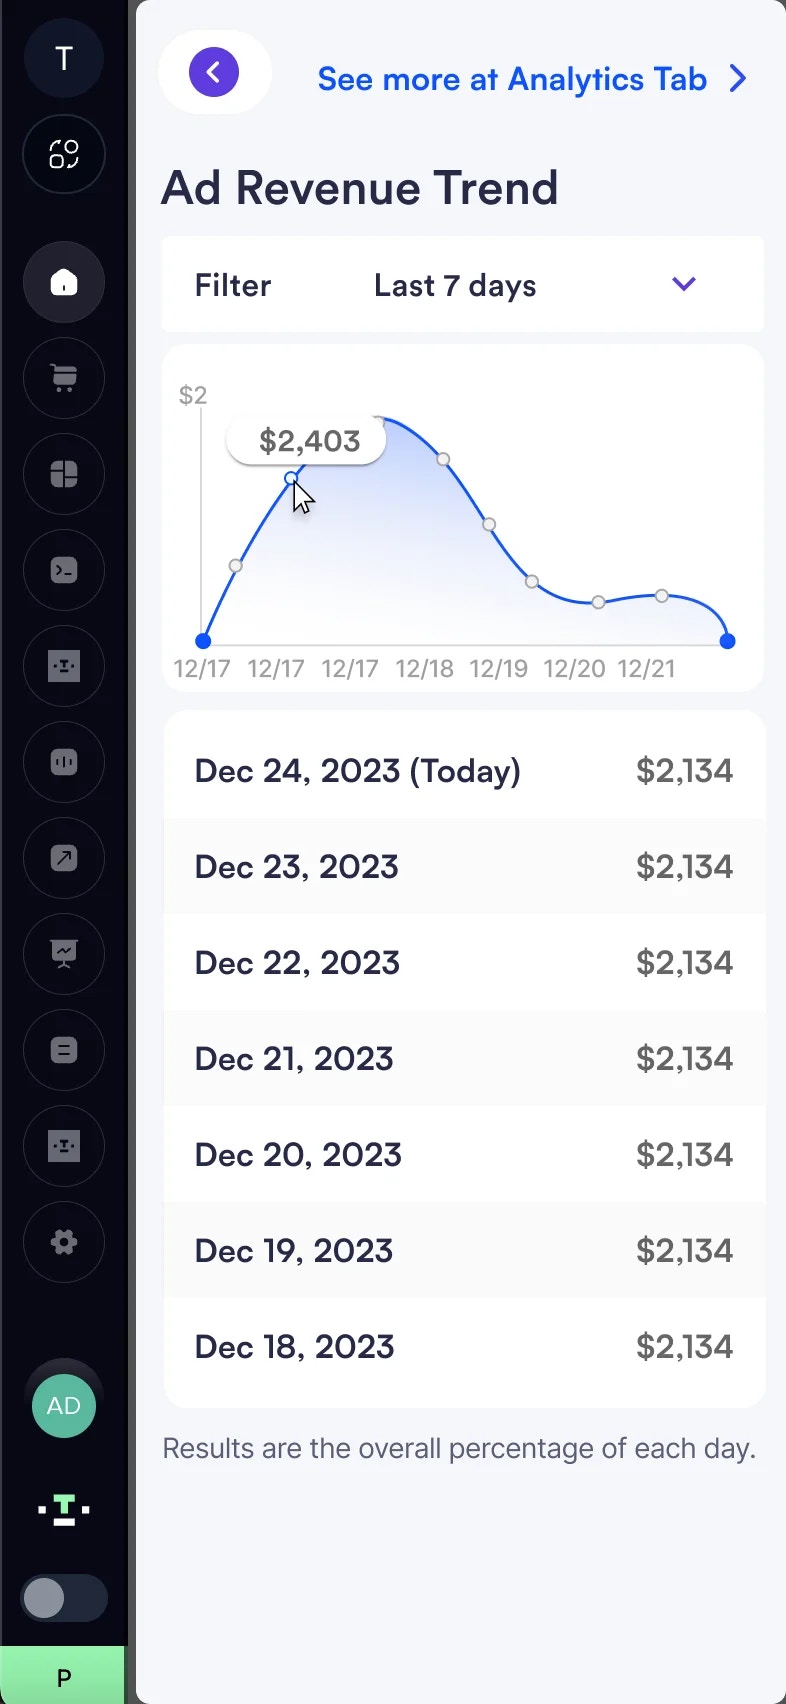
**Quick Reporting**: Tiles for Admin and Vendors now show metric trends comparing it with previous periods.

<Frame>
  <img src="https://mintcdn.com/topsort/IPYqfFwUqBX3axYX/images/changelog/7924b50-image.webp?fit=max&auto=format&n=IPYqfFwUqBX3axYX&q=85&s=e27cd099b93515a202acfcf7a8fff784" alt="quick reporting" width="430" height="276" data-path="images/changelog/7924b50-image.webp" />
</Frame>

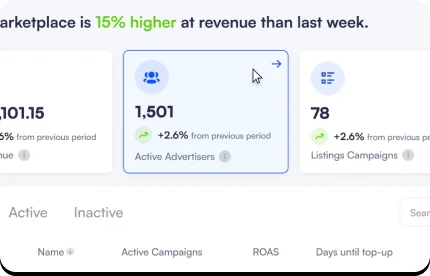
**Clickable Tiles**: The tiles are clickable and show a sidebar with actionable details about the metric
<Frame>
  <img src="https://mintcdn.com/topsort/M3N4mDiL0uw6VdTk/images/changelog/ecf90c0-image.webp?fit=max&auto=format&n=M3N4mDiL0uw6VdTk&q=85&s=03a08e068f55a09f979e538555f35fdb" alt="clickable tiles" width="786" height="1704" data-path="images/changelog/ecf90c0-image.webp" />
</Frame>

<ChangelogActions />