> ## Documentation Index
> Fetch the complete documentation index at: https://docs.topsort.com/llms.txt
> Use this file to discover all available pages before exploring further.
# Reports Tab
export const LastUpdated = ({date, lang = "en"}) => {
const translations = {
en: "Last updated:",
es: "Última actualización:",
pt: "Última atualização:",
fr: "Dernière mise à jour:",
de: "Zuletzt aktualisiert:"
};
const label = translations[lang] || translations.en;
return <>
;
};
In the Marketplace UI, open **Analytics > Reports** to monitor marketplace
advertising performance, compare periods, and drill into vendors or campaigns.
The **Analytics** section also includes the [Insights Tab](/en/knowledge-base/ad-platform/reporting-and-analytics/insights-tab) for AI-generated insights about anomalous marketplace trends.
## Overview
The Reports tab gives you a single view of how ads are performing across your marketplace. The page is organized around a summary of core KPIs and a set of insight cards that highlight spend efficiency, vendor performance, conversion, engagement, and cost trends.
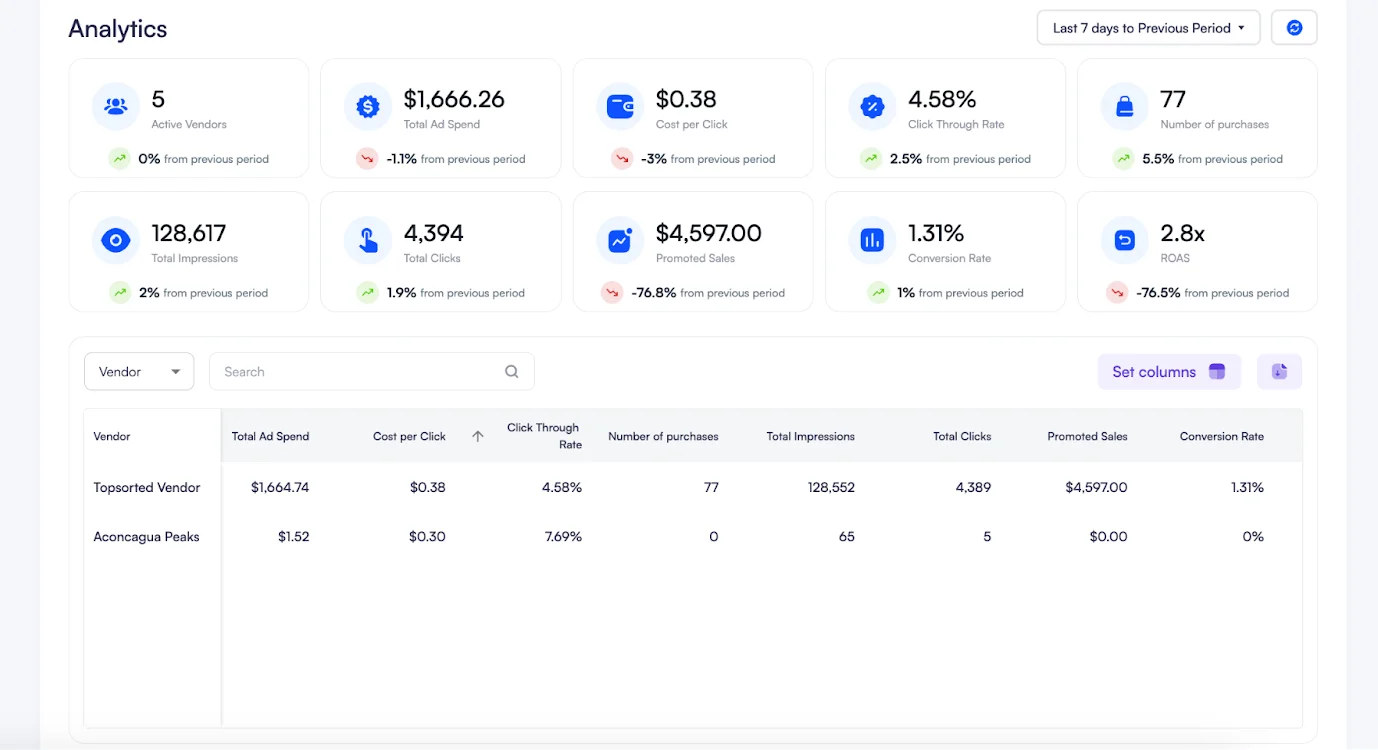
All headline metrics from the previous analytics experience remain available at the top of the page in a collapsible section, including total ad spend, impressions, clicks, purchases, and ROAS.
## Insight cards
Below the summary, insight cards group related metrics so you can scan performance at a glance. Each card shows absolute values for the selected period, percentage change versus the previous period, and, where relevant, a trend chart comparing the current and previous periods over time.
The page includes cards focused on:
* **Spend and return**: ROAS, ad spend, and promoted sales, with ROAS trends over time
* **Top vendors**: leading vendor performance, with sorting to compare vendors by metrics such as ad spend and promoted sales
* **Conversion**: conversion rate, purchases, and impressions
* **Click-through rate**: CTR and impressions, with CTR trends over time
* **Cost per click**: CPC and charged clicks, with CPC trends over time
Together, these cards make it easier to see whether changes are short-term fluctuations or part of a longer pattern, and which vendors are driving the most spend or sales.
## Filters
Filter the entire page by **ad format** and **date range** to focus on the placements and time window you care about.
You can also narrow the view to a specific **vendor name/id** or **campaign name/id**. When one of these filters is applied, all metrics and cards on the page reflect data aggregated for that vendor or campaign. You can answer performance questions for a single partner or campaign without leaving Reports.
 ## Glossary of Ad KPIs
Please refer to our [Glossary](/en/overview/glossary/) to review a list of common terms used in retail media.
## CSV Export
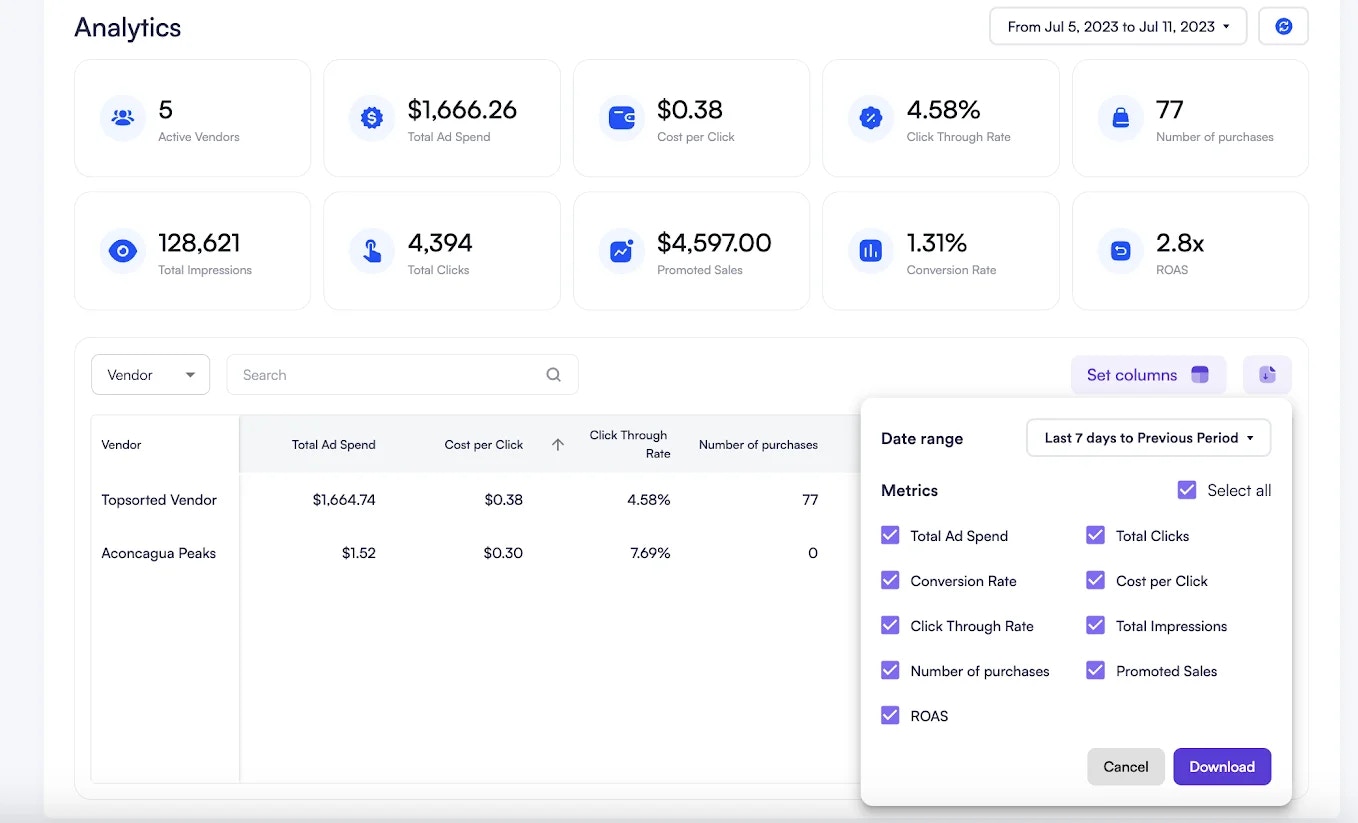
You can export the data that you see in the Reports tab, and can even customize which columns to download. Simply click on the purple export icon, choose which metrics and date range to include and download.
## Glossary of Ad KPIs
Please refer to our [Glossary](/en/overview/glossary/) to review a list of common terms used in retail media.
## CSV Export
You can export the data that you see in the Reports tab, and can even customize which columns to download. Simply click on the purple export icon, choose which metrics and date range to include and download.
 ***
***