The Analytics tab in Toppie provides comprehensive visibility into campaign performance for both agencies running campaigns and retailers hosting them. This analytics suite enables data-driven optimization and builds transparency across the entire Toppie ecosystem.
Key Benefits
Campaign Optimization
Understand what’s working and adjust strategies in real-time
Budget Allocation Insights
Make informed decisions about spending across marketplaces and products
Platform Transparency
See exactly how advertising spend translates to results
Demand Insights
Access detailed insights about campaign demand patterns
Reduced Manual Reporting
Access all performance data directly within the platform
For Agencies and Brands
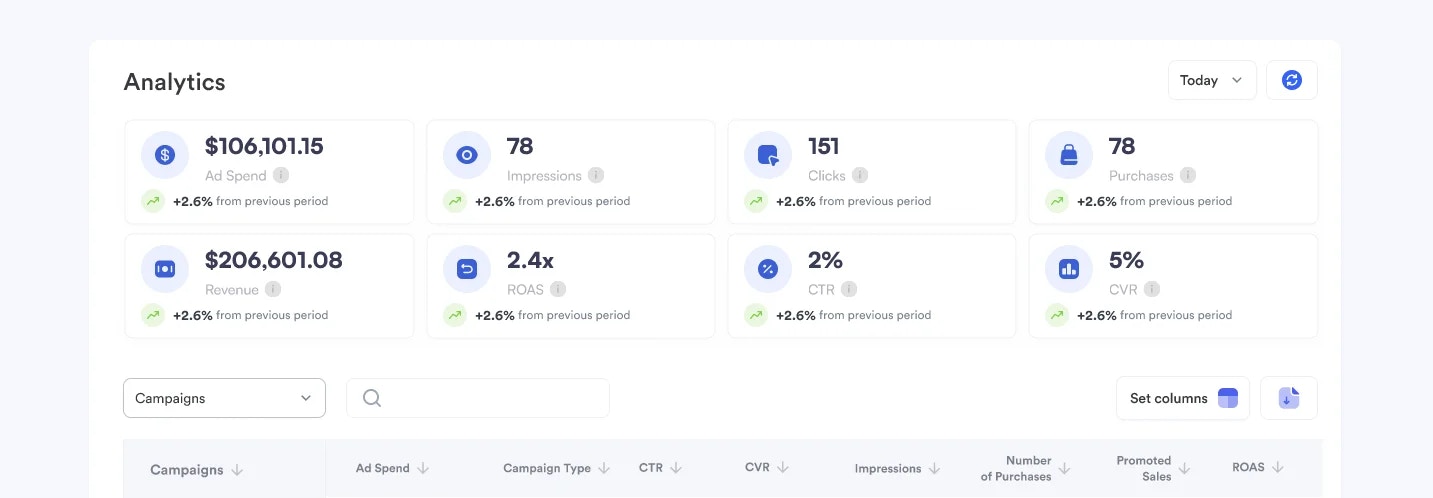
Core Metrics Available
- Ad Spend - Total and budget utilization across retail partners
- Impressions - Reach and visibility by marketplace
- Clicks - Click-through rates (CTR) and engagement metrics
- Purchases - Conversion rates (CVR) and sales attribution
- Revenue - Return on ad spend (ROAS) calculations
Campaign Analysis
Performance Tracking
The analytics dashboard provides real-time insights into:
- Cross-Retailer Performance - Compare campaign results across different retail partners
- Product-Level Analytics - Understand which products drive the best results
- Budget Efficiency - Track spending patterns and optimization opportunities
- Conversion Funnels - See the complete path from impression to purchase
For Retailers and Marketplaces
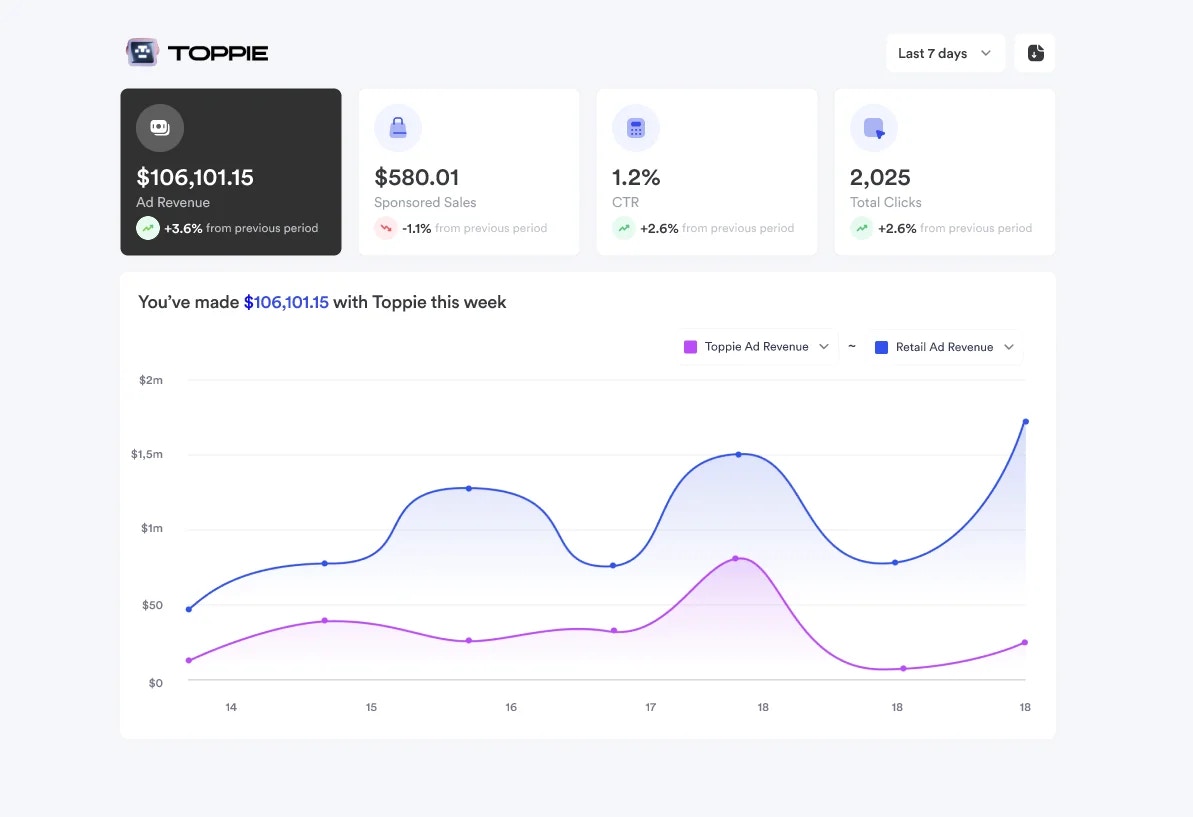
- Campaign Performance - Metrics from agency demand on your inventory
- Revenue Generation - Total revenue generated from Toppie campaigns
- Impression and Click Data - Engagement metrics for campaigns on your platform
- Demand Insights - Understanding which products and categories drive the most agency interest
Retailer Benefits
- Inventory Optimization - Understand which ad placements perform best
- Demand Forecasting - Predict future advertiser interest based on performance trends
- Revenue Reporting - Track incremental revenue from Toppie campaigns
- Competitive Intelligence - See category-level demand patterns (anonymized)
Attribution and Measurement
Toppie’s analytics use sophisticated attribution models to ensure accurate measurement:- View-Through Attribution - Credit for purchases influenced by ad impressions
- Click Attribution - Direct purchase attribution from ad clicks
- Cross-Device Tracking - Unified measurement across different devices and sessions
- Marketplace-Specific Windows - Respects each retailer’s attribution methodology
Data Export and Integration
Export Options
- CSV downloads for all performance data
- Scheduled reporting via email
- API access for custom integrations
Integration Capabilities
- Connect to business intelligence tools
- Custom dashboard creation
- Third-party reporting platform integration
Toppie Analytics transforms retail media performance data into actionable insights, enabling both advertisers and retailers to optimize their strategies and maximize results across the unified exchange.